Blackbox Monitoring with Prometheus
Prior to migrating from Cacti to Prometheus for infrastructure monitoring, I’d already been using Prometheus for blackbox monitoring. A couple of years ago I was looking for a way to monitor the health of various services I had deployed across virtual machines and containers running on my home network. I had used Pingdom for this in the past, but they killed their free plan in 2019. I had quite a few services to monitor, including multiple Web servers, a mail server, IRC server, and more. I surveyed the hosted service landscape but the available free options didn’t support the variety of services I needed to monitor; and the paid services cost as much as a single VPS at ARP Networks.
Since I was already running some infrastructure on Google Cloud Platform, I first took a look at Stackdriver (now Google Cloud Monitoring). Google Cloud Monitoring has support for uptime checks which can be used to perform blackbox monitoring of HTTP, HTTPS, and TCP services. However, at the time, uptime checks did not check for SSL certificate expiration, something I considered important given I was using 90 day Let’s Encrypt certificates and wanted to ensure that certificate rotation was working as expected. Also, the TCP checks are rather limited, simply confirming that a connection could be made. I wanted to check service health of TCP services (i.e. SMTP, IMAP, and IRC) as well.
I stumbled across Cloudprober and tried to get it working with Stackdriver. However, I never quite got it working the way I wanted. Finally, I discovered blackbox_exporter. At the time I had no experience with Prometheus, and since everyone was talking about it at the time, I figured it was time to learn.
To deploy blackbox_exporter on Kubernetes I used the following manifest:
apiVersion: v1
kind: ConfigMap
metadata:
  name: blackbox-exporter
  namespace: prometheus
data:
  config.yml: |
    modules:
      http_2xx:
        prober: http
        http:
          preferred_ip_protocol: ip4
          headers:
            User-Agent: Blackbox-Exporter
      imap_starttls:
        prober: tcp
        timeout: 5s
        tcp:
          preferred_ip_protocol: ip4
          query_response:
            - expect: "OK.*STARTTLS"
            - send: ". STARTTLS"
            - expect: "OK"
            - starttls: true
            - send: ". capability"
            - expect: "CAPABILITY IMAP4rev1"
      smtp_starttls:
        prober: tcp
        timeout: 5s
        tcp:
          preferred_ip_protocol: ip4
          query_response:
            - expect: "^220 ([^ ]+) ESMTP (.+)$"
            - send: "EHLO prober"
            - expect: "^250-STARTTLS"
            - send: "STARTTLS"
            - expect: "^220"
            - starttls: true
            - send: "EHLO prober"
            - expect: "^250-AUTH"
            - send: "QUIT"
      dns:
        prober: dns
        timeout: 5s
        dns:
          preferred_ip_protocol: ip4
          query_name: "matthoran.com"
          query_type: "A"
          validate_answer_rrs:
            fail_if_not_matches_regexp:
            - "206\\.125\\.170\\.166"
---
apiVersion: apps/v1
kind: Deployment
metadata:
  annotations:
  labels:
    app: blackbox-exporter
  name: blackbox-exporter
  namespace: prometheus
spec:
  replicas: 1
  selector:
    matchLabels:
      app: blackbox-exporter
  strategy:
    type: Recreate
  template:
    metadata:
      labels:
        app: blackbox-exporter
    spec:
      containers:
      - image: prom/blackbox-exporter:v0.22.0
        name: blackbox-exporter
        securityContext:
          runAsUser: 65534
        resources:
          requests:
            cpu: "100m"
          limits:
            cpu: "100m"
        volumeMounts:
        - mountPath: /etc/blackbox_exporter
          name: blackbox-exporter
      volumes:
      - configMap:
          defaultMode: 420
          name: blackbox-exporter
        name: blackbox-exporter
---
apiVersion: v1
kind: Service
metadata:
  labels:
    app: blackbox-exporter
  name: blackbox-exporter
  namespace: prometheus
spec:
  ports:
  - port: 9115
    protocol: TCP
    targetPort: 9115
  selector:
    app: blackbox-exporter
  type: ClusterIP
The modules in the configuration above define what sort of blackbox testing the blackbox_exporter can perform. For testing HTTP(s) targets I’ve defined an http_2xx module. This does what you’d expect — checking the response of an HTTP request for a 2XX response code. imap_starttls and smtp_starttls both make IMAP and SMTP connections, respectively, over TLS. This allows me to verify the certificates presented by my mail server, and that the server is up and running, rather than just opening a TCP socket. Finally, I’ve defined a dns module. dns verifies that the target DNS server returns the expected records.
Standing up Prometheus on Kubernetes is pretty simple as well. Today I’m using Google Managed Prometheus, but at the time I stood up Prometheus using a Deployment, PersistentVolume and PersistentVolumeClaim. I’d strongly recommend using some sort of managed Prometheus solution so that you don’t have to manage persistence yourself. Google Managed Prometheus handles long term metrics retention for you automatically, down-sampling as appropriate up to 24 months.
Given that you’ve deployed Google Managed Prometheus according to my post on the subject, the following ConfigMap tells Prometheus what targets to scrape via blackbox_exporter:
apiVersion: v1
kind: ConfigMap
metadata:
  name: blackbox-targets
  namespace: prometheus
data:
  dns.yml: |
    - labels:
        module: dns
      targets:
      - matthoran.com:53
      - ns1.he.net:53
      - ns2.he.net:53
      - ns3.he.net:53
      - ns4.he.net:53
      - ns5.he.net:53
  http.yml: |
    - labels:
        module: http_2xx  # Look for a HTTP 200 response.
      targets:
      - https://matthoran.com
      - https://blog.matthoran.com
The prometheus ConfigMap needs to be modified to load the blackbox targets from the *.yml files defined in the ConfigMap above:
---
apiVersion: v1
kind: ConfigMap
metadata:
  name: prometheus
  namespace: prometheus
data:
  config.yaml: |
    global:
      scrape_interval: 5m
      scrape_timeout: 30s

    scrape_configs:
    - job_name: 'blackbox'
      metrics_path: /probe
      file_sd_configs:
      - files:
        - '/etc/prometheus/blackbox/targets/*.yml'
      relabel_configs:
        - source_labels: [__address__]
          target_label: __param_target
        - source_labels: [module]
          target_label: __param_module
        - source_labels: [__param_target]
          target_label: instance
        - target_label: __address__
          replacement: blackbox-exporter:9115  # The blackbox exporter's real hostname:port.
Finally, Prometheus itself and the config-reloader sidecar need to be made aware of the blackbox targets configuration. Make the following changes to your prometheus StatefulSet:
apiVersion: apps/v1
kind: StatefulSet
metadata:
  namespace: prometheus
  name: prometheus
spec:
  replicas: 1
  selector:
    matchLabels:
      app: prometheus
  serviceName: prometheus
  template:
    metadata:
      labels:
        app: prometheus
    spec:
      automountServiceAccountToken: true
      nodeSelector:
        kubernetes.io/arch: amd64
        kubernetes.io/os: linux
      containers:
      - name: prometheus
        image: gke.gcr.io/prometheus-engine/prometheus:v2.35.0-gmp.2-gke.0
        args:
        - --config.file=/prometheus/config_out/config.yaml
        - --storage.tsdb.path=/prometheus/data
        - --storage.tsdb.retention.time=24h
        - --web.enable-lifecycle
        - --storage.tsdb.no-lockfile
        - --web.route-prefix=/
        ports:
        - name: web
          containerPort: 9090
        readinessProbe:
          httpGet:
            path: /-/ready
            port: web
            scheme: HTTP
        resources:
          requests:
            cpu: "100m"
          limits:
            cpu: "100m"
        volumeMounts:
        - name: config-out
          mountPath: /prometheus/config_out
          readOnly: true
        - name: prometheus-db
          mountPath: /prometheus/data
        - mountPath: /etc/prometheus/blackbox/targets
          name: blackbox-targets
      - name: config-reloader
        image: gke.gcr.io/prometheus-engine/config-reloader:v0.4.3-gke.0
        args:
        - --config-file=/prometheus/config/config.yaml
        - --config-file-output=/prometheus/config_out/config.yaml
        - --reload-url=http://localhost:9090/-/reload
        - --listen-address=:19091
        - --watched-dir=/prometheus/blackbox/targets
        ports:
        - name: reloader-web
          containerPort: 8080
        resources:
          requests:
            cpu: "50m"
          limits:
            cpu: "50m"
        volumeMounts:
        - name: config
          mountPath: /prometheus/config
        - name: config-out
          mountPath: /prometheus/config_out
        - mountPath: /prometheus/blackbox/targets
          name: blackbox-targets
      terminationGracePeriodSeconds: 600
      volumes:
      - name: prometheus-db
        emptyDir: {}
      - name: config
        configMap:
          name: prometheus
          defaultMode: 420
      - name: config-out
        emptyDir: {}
      - configMap:
          defaultMode: 420
          name: blackbox-targets
        name: blackbox-targets
With all this in place, Prometheus will probe your blackbox targets every 5 minutes (or your scrape_interval).
Having these metrics in Prometheus (and Monarch, for Google Managed Prometheus) in and of itself isn’t particularly useful. I needed some alerting! In my first endeavor setting up Prometheus and blackbox_exporter, I used Prometheus alerting along with Alertmanager to send email and SMS notifications for alerts. This worked great, but had a few weaknesses. First, I was using my cell phone provider’s email to SMS gateway to send SMS messages. This didn’t always work well. Also, since Alertmanager was running on GKE, I needed to use SendGrid outbound SMTP. While this worked fine, I wanted something better. Finally, there was a single point of failure in that I was managing the monitoring and alerting platform on GKE.
I’d separately been playing with Grafana Cloud and discovered that Grafana OnCall had recently been rolled out. Grafana OnCall could be used to replace the unreliable email to SMS gateway from my cell phone provider. Plus if I moved to using Grafana managed alerts I could remove the single point of failure for alerting.
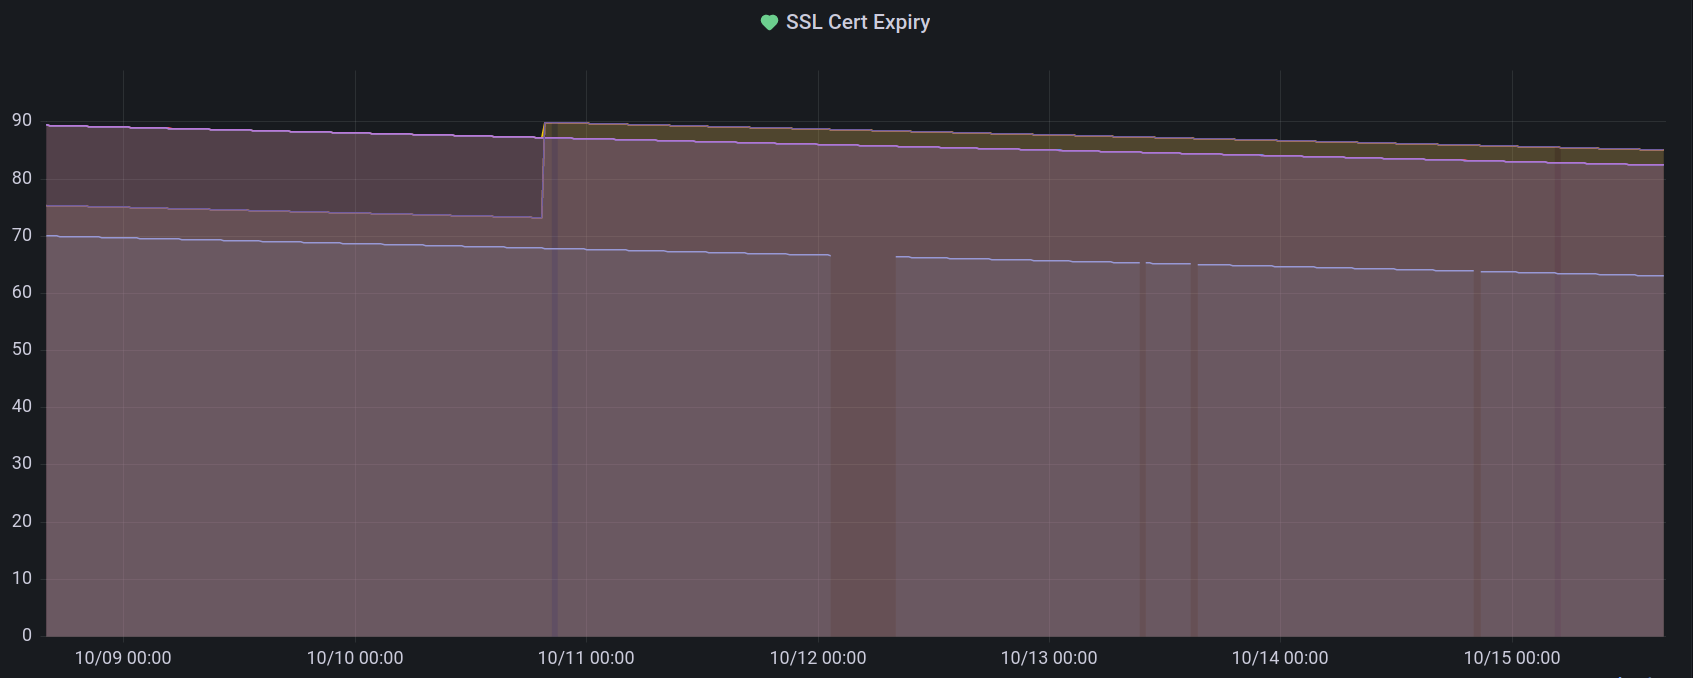
Moving over to Grafana managed alerts from Prometheus alerting was pretty easy. I now reliably get SMS messages for outages, and the same grouping functionality is available from Grafana managed alerts as with Prometheus and Alertmanager. Plus I can easily check on the status of the my blackbox probes, for example by graphing SSL certificate expiry.
For alerting on probe failure, I have an alert set up with the following query:
min by(instance) (up{job="blackbox"} == 0 or probe_success{job="blackbox"})
More completely, the alert rule is configured as follows:
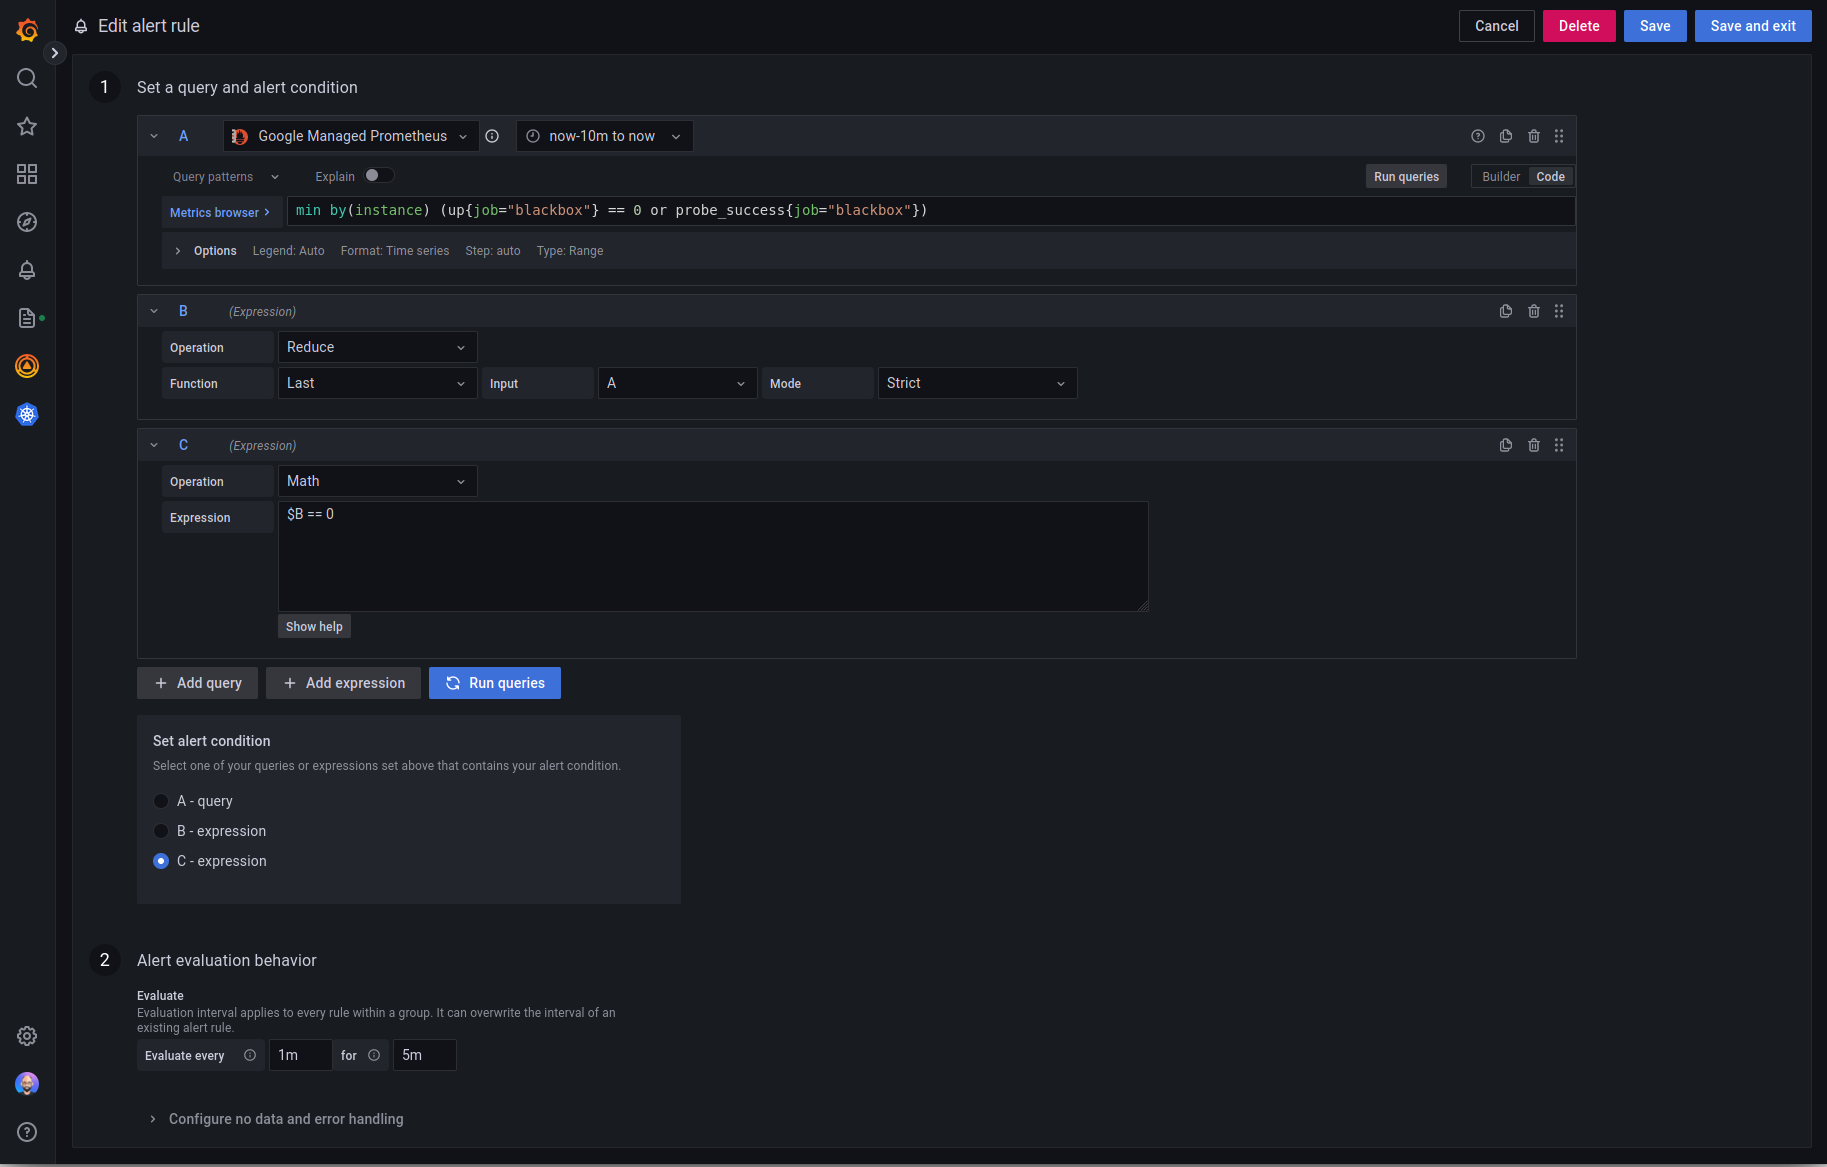
The query is a bit convoluted, so I’ll take a second to explain it. First, we check for any defined blackbox targets that are not up. This means that either the blackbox exporter is down, or the exporter could not connect to the target. Second, given the exporter could connect to the target, we check whether the probe succeeded. The or is a bit tricky here, but it is simply the union between up and probe_success (because of the == 0 on up, if the target is up, only probe_success will be returned for that target, and vice versa).
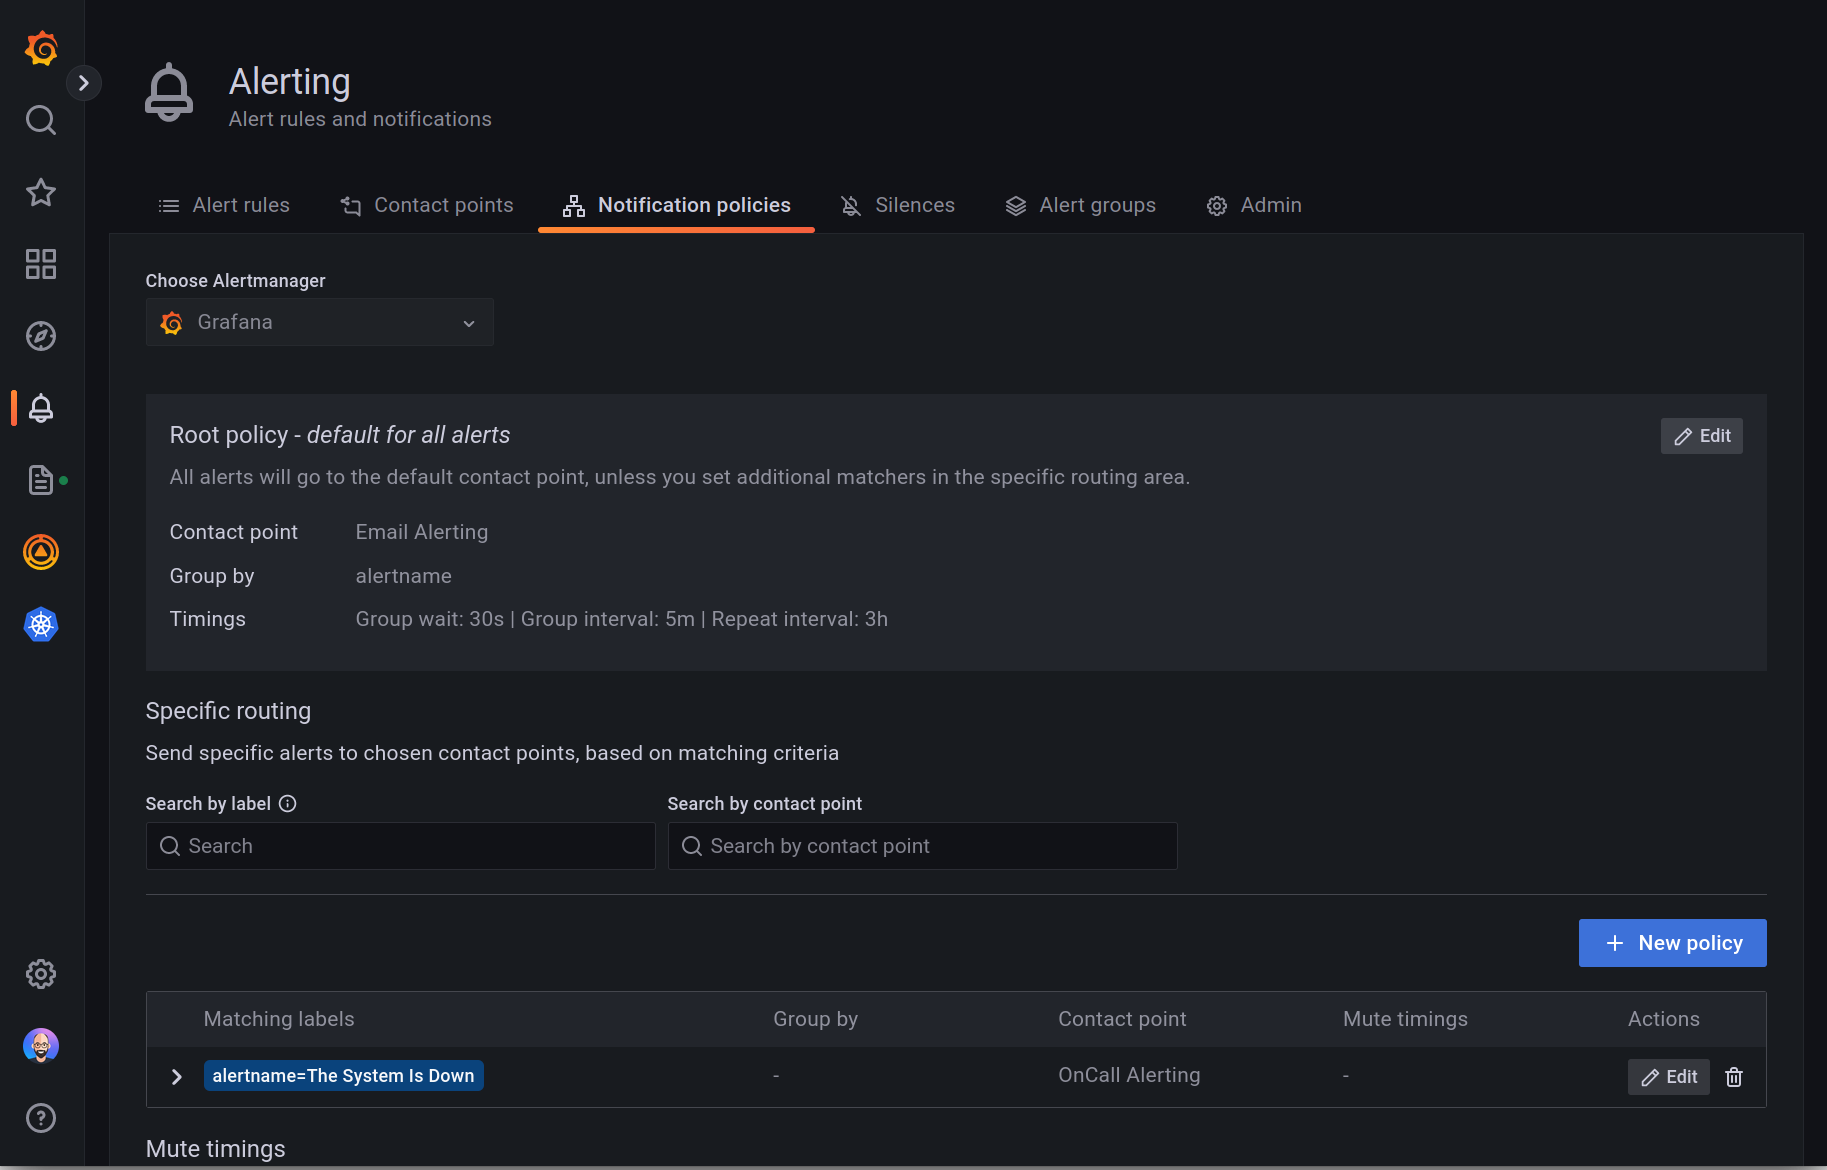
Grafana notification policies can be used to configure how alerts are routed to contact points. This can include simple email alerts or an on-call rotation through Grafana OnCall or PagerDuty. Below is a screenshot of my notification policy. I’ve configured the “root policy” to send email notifications only, waiting 30 seconds to group alerts prior to the first notification, and 5 minutes for subsequent alerts. Finally, notifications will be resent every 3 hours. For critical systems, I’ve overridden the root policy to use Grafana OnCall, resulting in both SMS and email notifications for those alerts.