Migrating from Cacti to (Google Managed) Prometheus
I’ve been using Cacti to monitor infrastructure for nearly 20 years. Cacti is a great tool for polling devices via SNMP and renders pretty graphs via RRDtool. However, I’ve been trying to consolidate infrastructure and have settled on Kubernetes (specifically, Google Kubernetes Engine) for running as much of my infrastructure as possible. While it’d be possible to run Cacti on Kubernetes, I wanted to find another option that was more “Kubernetes native”.
Separately, I’d been using Prometheus and blackbox_exporter (more on that in a coming post) to healthcheck various services deployed across Kubernetes and various virtual machines. This had been working great for over a year. However, similarly to Cacti, Prometheus has a persistence dependency, which introduces a slight maintenance burden when running on Kubernetes.
For data visualization, Prometheus is generally fronted with Grafana. I use Grafana at my day job and wanted to get a bit more comfortable using it. Also, the great folks behind Grafana at Grafana Labs had launched a managed Grafana service, Grafana Cloud, and a personal goal of mine has been to run less infrastructure myself.
Google recently launched Google Managed Prometheus. Finally I had a solution for the long term data storage needs of migrating away from Cacti to Prometheus! Google Managed Prometheus is a shim between Prometheus and Monarch, Google’s managed time series database offering. Google Managed Prometheus will store metrics scraped from Prometheus exporters for up to 24 months, with down-sampling to 1 minute at 5 weeks and 10 minutes for the remainder of the retention period. This would be perfect for my needs!
To deploy Prometheus I followed the instructions for self-deployed collection. Alternatively, if all the metrics endpoints (including exporters) you plan to scrape are deployed on the same Kubernetes cluster, you can use managed collection. In my case it was a bit easier to get up and running with self-deployed collection as I was migrating from an existing Prometheus instance. Also, I had planned to run the snmp_exporter outside of the Kubernetes cluster, which can’t be scraped with managed collection.
In addition to deploying the forked managed of Prometheus as per the documentation above, connecting Grafana to Google Managed Prometheus requires deployment of a separate frontend. This is because Google’s Prometheus API requires OAuth2, which is not currently supported by Grafana. There is a desire from Google to deprecate the frontend as well, but until OAuth2 support is added to the Prometheus data source, the frontend will still be required.
I discovered an issue with the Google Managed Prometheus endpoint that was causing timeouts in the Grafana UI and quite often in Grafana managed alerts. In order to (partially) address these timeouts, I added two annotations to the frontend Ingress. The first was to lower the upstream connection timeout. The second was to retry on connection timeout. This helped stabilize the Grafana UI significantly. However, sometimes alerts do still time out — and Grafana managed alerts do not respect the configured timeouts for a data source, instead timing out at 30 seconds.
Below is the Kubernetes Ingress with the aforementioned annotations to work around the timeouts:
apiVersion: networking.k8s.io/v1
kind: Ingress
metadata:
  annotations:
    # add http_503 to retry after connect timeout
    nginx.ingress.kubernetes.io/proxy-next-upstream: error timeout http_503
    # lowered from default of 5
    nginx.ingress.kubernetes.io/proxy-connect-timeout: "3"
  name: frontend
  namespace: prometheus
spec:
  ingressClassName: nginx
  rules:
  - host: <desired-frontend-hostname>
    http:
      paths:
      - backend:
          service:
            name: frontend
            port:
              number: 9090
        pathType: ImplementationSpecific
Note that I’m also using a forked version of the frontend while I await the merging of a PR that addresses issues with HTTP basic auth in the frontend.
With Google Managed Prometheus now up and running, it was time to deploy an exporter. For my Cacti migration use case there exists the snmp_exporter. snmp_exporter supports many devices out of the box in the default snmp.yml. Missing from this configuration is support for systems running Net-SNMP, OpenBSD snmpd, or FreeBSD bsnmpd. However, adding support for these SNMP servers was trivial.
snmp_exporter includes a generator tool and corresponding Docker image. The following Dockerfile and generator.yml can be used to generate a snmp.yml supporting the above SNMP servers. Note that I have stripped out support for other devices from this configuration. If support for other devices is desired, simply add those devices back to generator.yml.
FROM quay.io/prometheus/snmp-generator:latest

COPY mibs/ /opt/mibs/
COPY generator.yml /opt/generator.yml

WORKDIR /opt

RUN /go/bin/generator generate

FROM quay.io/prometheus/snmp-exporter:latest

COPY --from=0 /opt/snmp.yml /etc/snmp_exporter/snmp.yml

EXPOSE      9116
ENTRYPOINT  [ "/bin/snmp_exporter" ]
CMD         [ "--config.file=/etc/snmp_exporter/snmp.yml" ]
modules:
  net_snmp:
    walk:
      - sysUpTime
      - interfaces
      - ifXTable
      - 1.3.6.1.2.1.25.1.5 # hrSystemNumUsers
      - 1.3.6.1.2.1.25.1.6 # hrSystemProcesses
      - 1.3.6.1.2.1.25.2 # hrStorage
      - 1.3.6.1.2.1.25.3.3.1.2 # hrProcessorLoad
      - 1.3.6.1.4.1.2021.4 # memory
      - 1.3.6.1.4.1.2021.10.1.1 # laIndex
      - 1.3.6.1.4.1.2021.10.1.2 # laNames
      - 1.3.6.1.4.1.2021.10.1.5 # laLoadInt
      - 1.3.6.1.4.1.2021.11 # systemStats
    lookups:
      - source_indexes: [ifIndex]
        lookup: ifAlias
      - source_indexes: [ifIndex]
        # Uis OID to avoid conflict with PaloAlto PAN-COMMON-MIB.
        lookup: 1.3.6.1.2.1.2.2.1.2 # ifDescr
      - source_indexes: [ifIndex]
        # Use OID to avoid conflict with Netscaler NS-ROOT-MIB.
        lookup: 1.3.6.1.2.1.31.1.1.1.1 # ifName
        drop_source_indexes: true

      - source_indexes: [laIndex]
        lookup: laNames
        drop_source_indexes: true

      - source_indexes: [hrStorageIndex]
        lookup: hrStorageDescr
        drop_source_indexes: true
    overrides:
      ifAlias:
        ignore: true # Lookup metric
      ifDescr:
        ignore: true # Lookup metric
      ifName:
        ignore: true # Lookup metric
      ifType:
        type: EnumAsInfo

      hrStorageDescr:
        ignore: true

      laNames:
        ignore: true

  openbsd:
    walk:
      - sysUpTime
      - interfaces
      - ifXTable
      - 1.3.6.1.2.1.25.1.6 # hrSystemProcesses
      - 1.3.6.1.2.1.25.2 # hrStorage
      - 1.3.6.1.2.1.25.3.3.1.2 # hrProcessorLoad
    lookups:
      - source_indexes: [ifIndex]
        lookup: ifAlias
      - source_indexes: [ifIndex]
        # Uis OID to avoid conflict with PaloAlto PAN-COMMON-MIB.
        lookup: 1.3.6.1.2.1.2.2.1.2 # ifDescr
      - source_indexes: [ifIndex]
        # Use OID to avoid conflict with Netscaler NS-ROOT-MIB.
        lookup: 1.3.6.1.2.1.31.1.1.1.1 # ifName
        drop_source_indexes: true

      - source_indexes: [hrStorageIndex]
        lookup: hrStorageDescr
        drop_source_indexes: true
    overrides:
      ifAlias:
        ignore: true # Lookup metric
      ifDescr:
        ignore: true # Lookup metric
      ifName:
        ignore: true # Lookup metric
      ifType:
        type: EnumAsInfo

      hrStorageDescr:
        ignore: true

  ubiquiti:
    walk:
      - sysUpTime
      - interfaces
      - ifXTable
      - 1.3.6.1.2.1.25.1.5 # hrSystemNumUsers
      - 1.3.6.1.2.1.25.3.3.1.2 # hrProcessorLoad
      - 1.3.6.1.4.1.2021.4 # memory
      - 1.3.6.1.4.1.2021.10.1.1 # laIndex
      - 1.3.6.1.4.1.2021.10.1.2 # laNames
      - 1.3.6.1.4.1.2021.10.1.5 # laLoadInt
    lookups:
      - source_indexes: [ifIndex]
        lookup: ifAlias
      - source_indexes: [ifIndex]
        # Uis OID to avoid conflict with PaloAlto PAN-COMMON-MIB.
        lookup: 1.3.6.1.2.1.2.2.1.2 # ifDescr
      - source_indexes: [ifIndex]
        # Use OID to avoid conflict with Netscaler NS-ROOT-MIB.
        lookup: 1.3.6.1.2.1.31.1.1.1.1 # ifName
        drop_source_indexes: true

      - source_indexes: [laIndex]
        lookup: laNames
        drop_source_indexes: true
    overrides:
      ifAlias:
        ignore: true # Lookup metric
      ifDescr:
        ignore: true # Lookup metric
      ifName:
        ignore: true # Lookup metric
      ifType:
        type: EnumAsInfo

      laNames:
        ignore: true

  lm_sensors:
    walk:
      - lmSensors

    lookups:
      - source_indexes: [lmFanSensorsIndex]
        lookup: lmFanSensorsDevice
        drop_source_indexes: true
      - source_indexes: [lmTempSensorsIndex]
        lookup: lmTempSensorsDevice
        drop_source_indexes: true
      - source_indexes: [lmVoltSensorsIndex]
        lookup: lmVoltSensorsDevice
        drop_source_indexes: true

    overrides:
      lmFanSensorsDevice:
        ignore: true # Lookup metric
      lmTempSensorsDevice:
        ignore: true # Lookup metric
      lmVoltSensorsDevice:
        ignore: true # Lookup metric
Note that the appropriate MIBs must be downloaded to the mibs directory alongside the Dockerfile. The generator Makefile can be used to download many default MIBs. An additional MIB I downloaded above is the LM-SENSORS-MIB which supports polling lm-sensors data via Net-SNMP, allowing me to graph fan speed and temperature.
Deploying the snmp_exporter on Kubernetes is easy. All that is needed is a Deployment and a Service:
apiVersion: apps/v1
kind: Deployment
metadata:
  annotations:
  labels:
    app: snmp-exporter
  name: snmp-exporter
  namespace: prometheus
spec:
  replicas: 1
  selector:
    matchLabels:
      app: snmp-exporter
  strategy:
    type: Recreate
  template:
    metadata:
      labels:
        app: snmp-exporter
    spec:
      containers:
      - image: <image-generated-by-generator>
        imagePullPolicy: Always
        name: snmp-exporter
        securityContext:
          runAsUser: 65534
        resources:
          requests:
            cpu: "100m"
          limits:
            cpu: "100m"
---
apiVersion: v1
kind: Service
metadata:
  labels:
    app: snmp-exporter
  name: snmp-exporter
  namespace: prometheus
spec:
  ports:
  - port: 9116
    protocol: TCP
    targetPort: 9116
  selector:
    app: snmp-exporter
  type: ClusterIP
With all the dependencies now up and running, Prometheus can be configured to scrape the snmp_exporter. The following config.yaml shows how to scrape the snmp_exporter deployed previously for the various modules defined in generator.yml above.
apiVersion: v1
kind: ConfigMap
metadata:
  name: prometheus
  namespace: prometheus
data:
  config.yaml: |
    global:
      scrape_interval: 5m
      scrape_timeout: 30s

    scrape_configs:
    - job_name: 'snmp'
      static_configs:
        - labels:
            module: net_snmp
          targets:
            - <net-snmp-target>
        - labels:
            module: openbsd
          targets:
            - <openbsd-target>
        - labels:
            module: ubiquiti
          targets:
            - <ubiquiti-target>
        - labels:
            module: lm_sensors
          targets:
            - <lm-sensors-target>
      metrics_path: /snmp
      relabel_configs:
        - source_labels: [__address__]
          target_label: __param_target
        - source_labels: [module]
          target_label: __param_module
        - action: labeldrop
          regex: module
        - source_labels: [__param_target]
          target_label: instance
        - target_label: __address__
          replacement: snmp-exporter:9116  # The SNMP exporter's real hostname:port.
      metric_relabel_configs:
      # strip extraneous text from hrStorageDescr
      - source_labels: [hrStorageDescr]
        regex: '([^,]+).*'
        target_label: hrStorageDescr

      # drop hrStorage entries not matching the given (host, mount-point) pair
      - source_labels: [instance, hrStorageDescr]
        regex: '<net-snmp-target>;/'
        target_label: __tmp_keep_me
        replacement: true
      # repeat above as necessary per (host, mount-point) pair
      - source_labels: [hrStorageDescr, __tmp_keep_me]
        regex: '.+;'
        action: drop
      - action: labeldrop
        regex: __tmp_keep_me

      # drop metrics that aren't being graphed
      - source_labels: [__name__]
        regex: 'hrProcessorLoad|ifHCInOctets|ifHCOutOctets|hrStorageSize|hrStorageUsed|hrStorageAllocationUnits|memTotalReal|memBuffer|memCached|memAvailReal|laLoadInt|lmFanSensorsValue|lmTempSensorsValue|up'
        action: keep
Graphing the metrics scraped above with Grafana is easy. Simply add a Prometheus data source and configure it as required. Set the URL to point at the Ingress of the frontend deployed above. Set the timeout to 120 seconds. I recommend enabling basic auth. Disable “Manage alerts via Alerting UI” — this doesn’t work with Google Managed Prometheus. Finally, set your scrape interval to the scrape interval defined in your config.yaml from the prometheus ConfigMap. Set the query timeout to 2m and the HTTP method to GET. Click “Save & test” and you should be up and running!
Here’s an example of a dashboard showing metrics scraped from a Linux host running Net-SNMP:
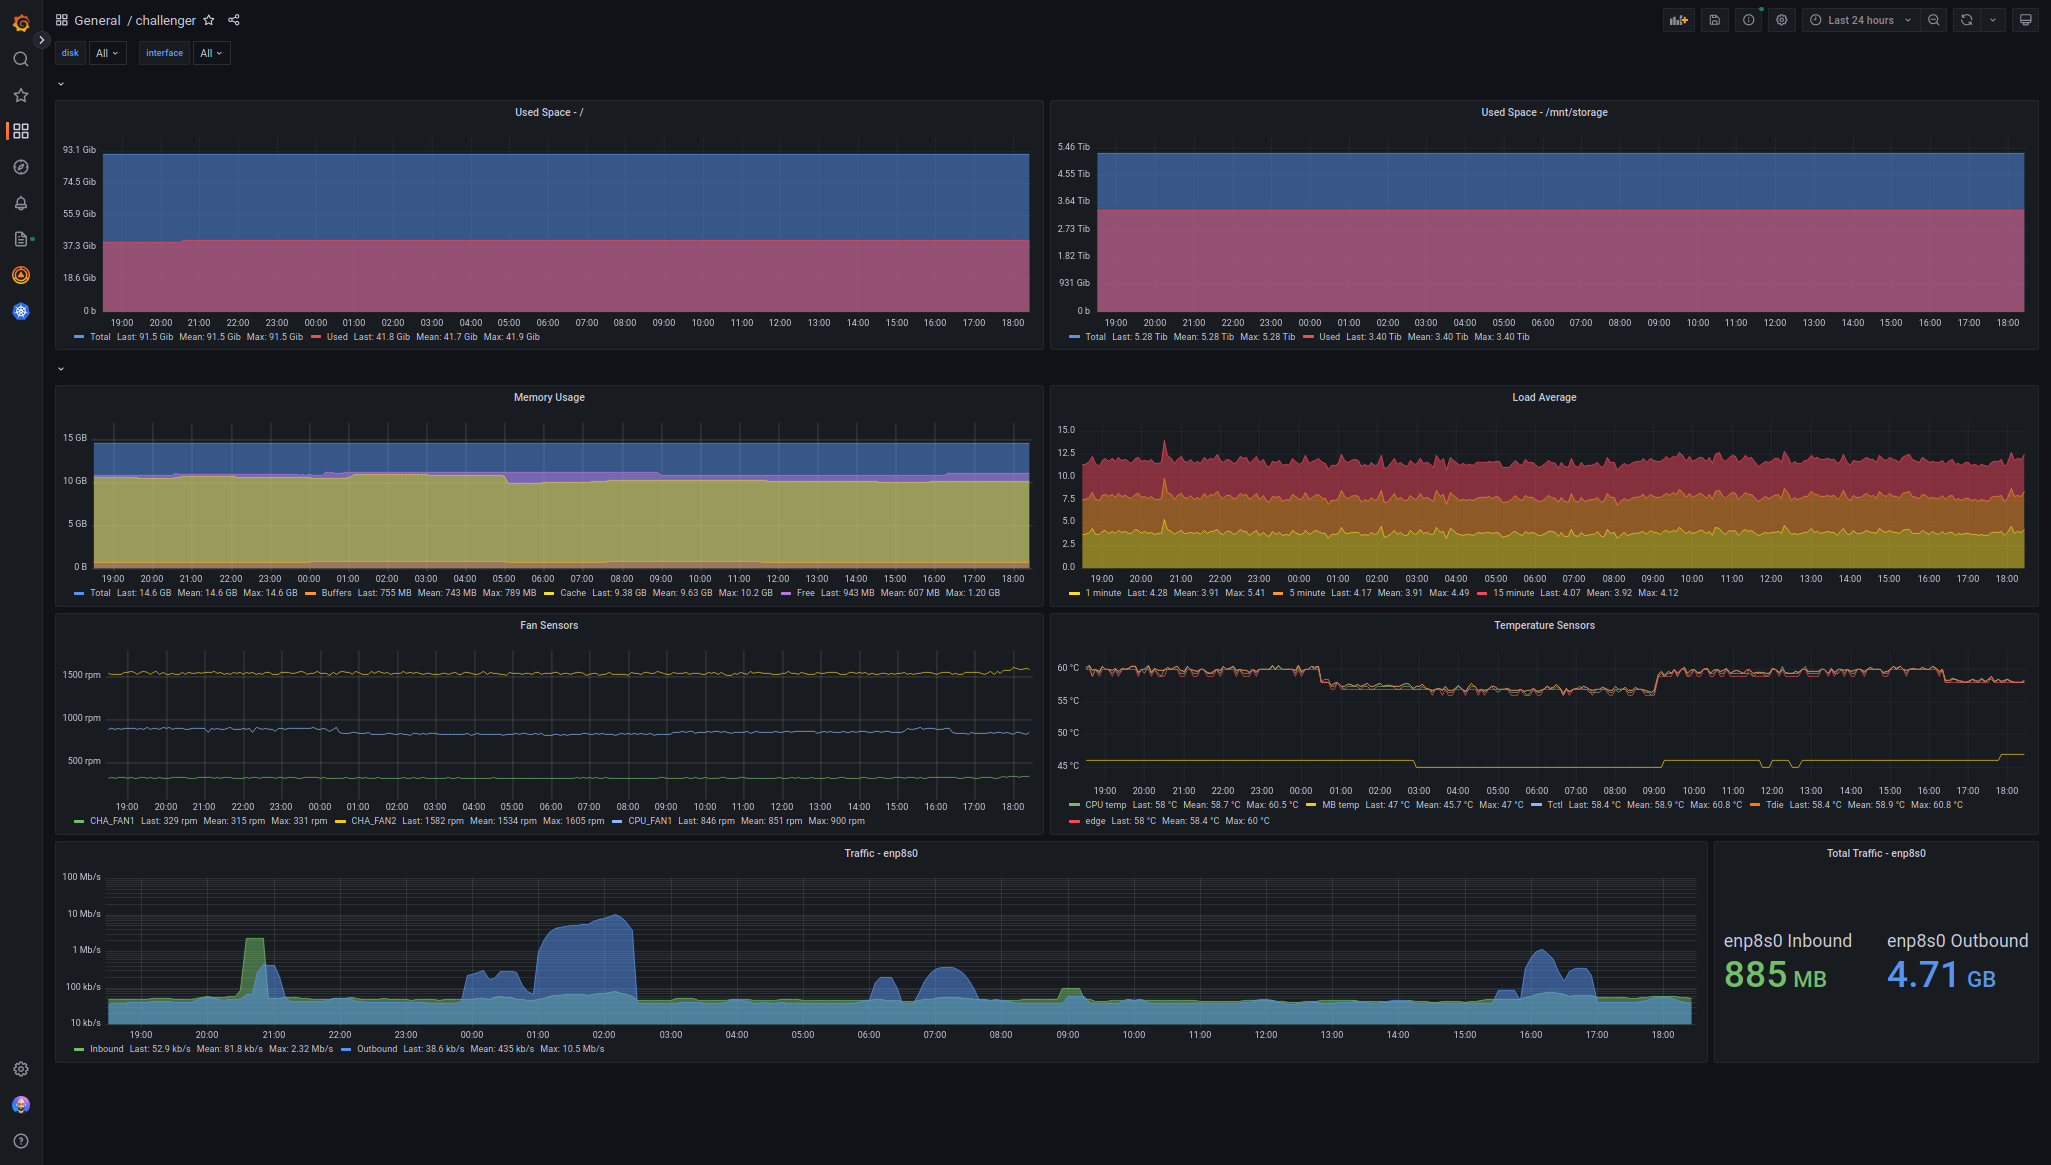
I’m super happy with this setup. I’ve been trying to move to managed services wherever possible. Google Managed Prometheus allows me to feed two birds with one scone. While I still have to manage the Prometheus instance in my Kubernetes cluster, I don’t have to worry about storage. With Grafana Cloud, I don’t have to manage my own Grafana instance. The resource usage of Google Managed Prometheus within my cluster, as well as the frontend component for handling OAuth2 to the backend is minimal.
Some parts of the experience are still a bit rough around the edges, like the frontend. However, I expect this to improve in the future once native OAuth2 support is added for Prometheus endpoints in Grafana. At that point I’ll be able to remove another self managed component from my Kubernetes cluster.
Last but not least, I was delighted to discover that a former colleague of mine, Lee Yanco, is the product manager for Google Managed Prometheus. It’s always a pleasure to run into a former Pivot out in the wild, and true to form Lee has been great to work with in debugging some of the challenges I’ve run into when migrating to Google Managed Prometheus.
Stay tuned for more on how I use Prometheus (now Google Managed Prometheus) and blackbox_exporter to monitor the (unfortunately) many other services I manage.